Workflow#
The prolint2 design is characterized by a sequential workflow that involves four main object types. Each object in the sequence depends on one or more of the previous objects, allowing you to accumulate information as you progress through the analysis. The figure below represents the object types and sequential workflow.

1. ProLint2 Universe: Building the Foundation#
The ProLint2 Universe is the starting point for your lipid-protein interaction analysis. The ProLint2 Universe is essentially an MDAnalysis Universe with additional methods and attributes tailored to the specific needs of ProLint2. This means you have access to all the methods and attributes available in a typical MDAnalysis Universe, and beyond. This compatibility ensures that you can use your existing knowledge of MDAnalysis while benefiting from ProLint2’s added functionality. It provides a robust foundation for accessing and handling your system’s trajectory data. Whether you are loading sample datasets or your own custom data, the ProLint2 Universe simplifies the process and allows you to seamlessly transition to the next steps of your analysis.
In order to analyze lipid-protein interactions using prolint2, it is essential to know how the software identifies and distinguishes between the two primary components of your system. prolint2 differentiates between the lipid component, referred to as the database, and the protein component, referred to as the query. This distinction is crucial to comprehending the subsequent analysis of the interactions.
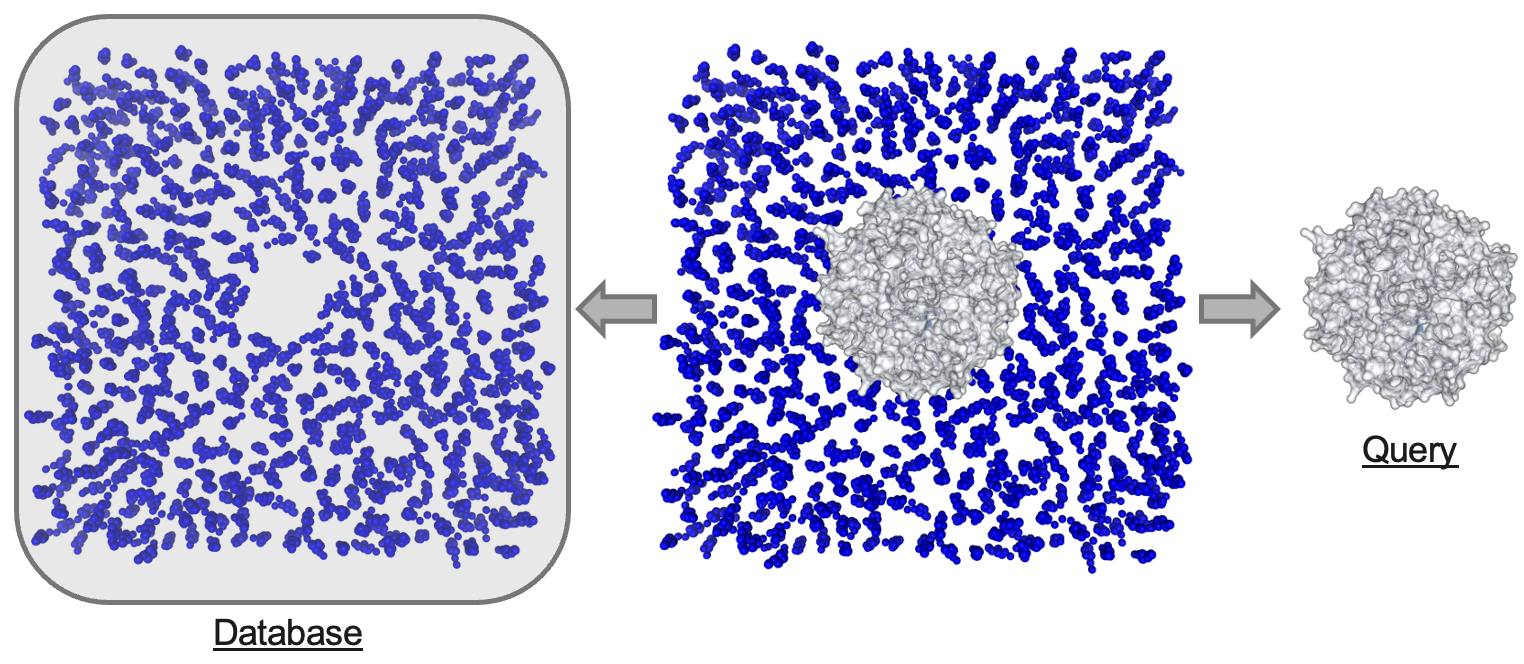
When you load your trajectory data into prolint2, the software will automatically categorize the residues into one of these two groups. This categorization is primarily based on the residue name. Here is how it works:
Query: Any residue with a name corresponding to an amino acid or a modified amino acid will be assigned to the query component.
Database: Residues with names that match any of the lipid names in prolint2’s library will be automatically assigned to the database component.
This automated categorization simplifies your workflow significantly. You will not need to manually remove irrelevant residues, as prolint2 will disregard any residues not assigned to either the query or the database components.
2. Contacts: Tracking Lipid-Protein Interactions#
Moving forward in the sequential flow, the subsequent step in building information about the interactions between lipids and protein residues is the Contacts class. This class is designed to store and organize information about the interactions on each frame, defining interactions where the distance between at least one atom on each group is less than a predefined cutoff.
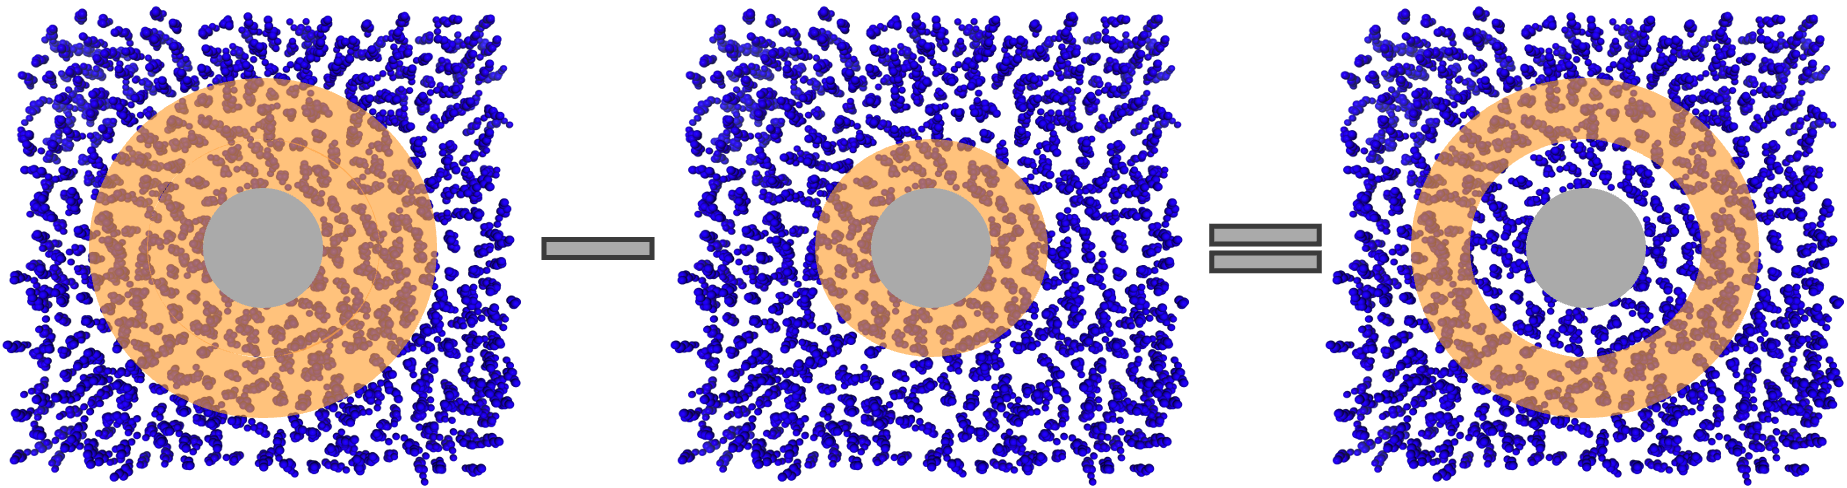
This class includes arithmetic operations that enable the creation of more complex contact schemas. For example, it can be used to analyze annular lipid distributions, when a shell of contacts with a larger cutoff is calculated, along with a core of contacts with a smaller cutoff. By subtracting/removing the core from the shell, a donut-shaped instance of contacts is formed, as represented in the figure below.
We have loaded our trajectory as a Universe and created a contacts instance to store all the contacts between the query and the database. Now, we need to make sense of the contacts by using various metrics and plots. To design these tools, we have considered a model that represents different levels of interactions between lipids and proteins, as shown in the diagram below.
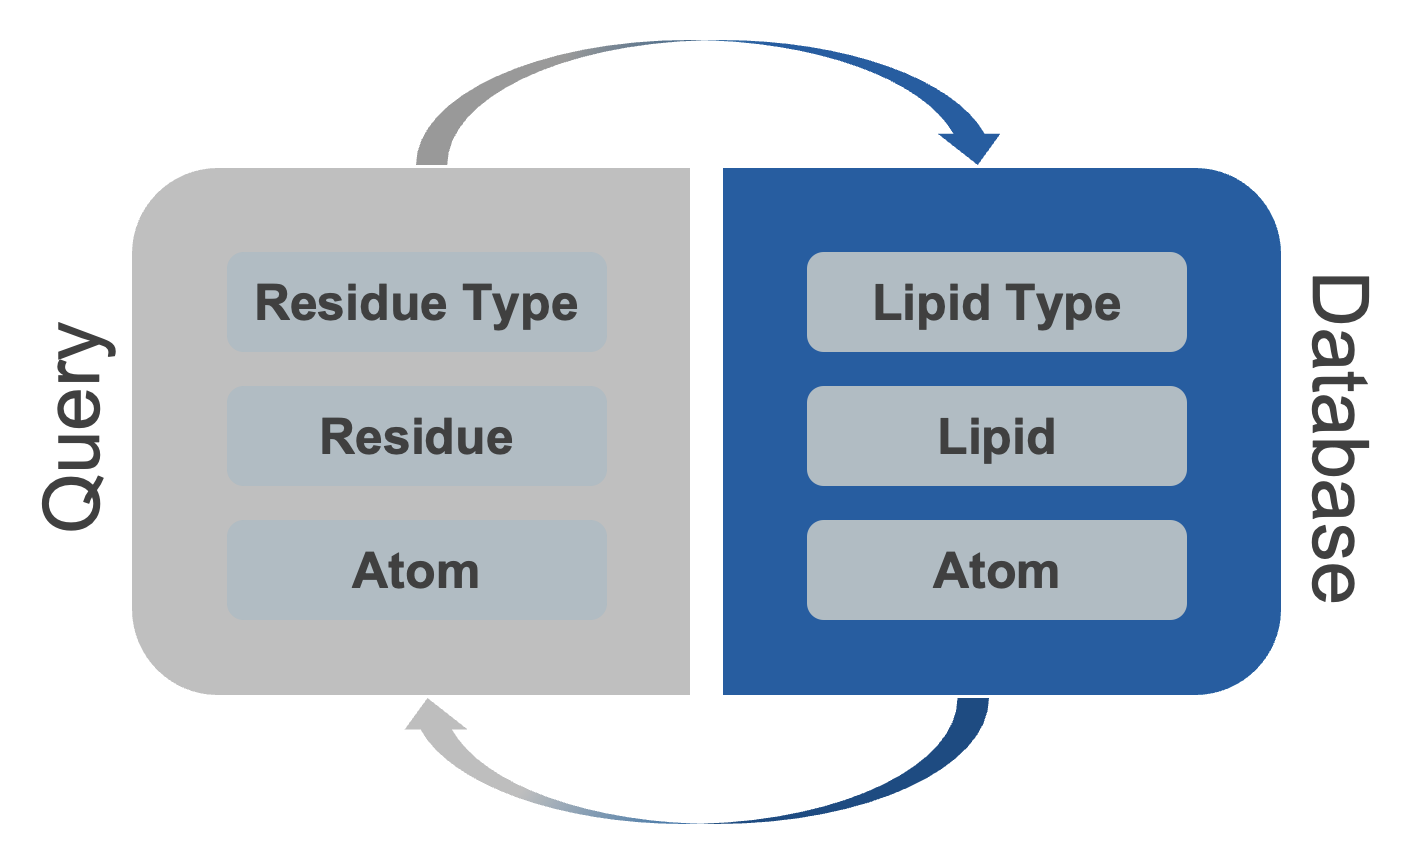
prolint2 offers insights into different aspects of lipid-protein interactions at varying levels of detail. Whether you want to determine which part of a protein residue is crucial for the interaction (backbone or sidechain), the importance of specific lipid components (headgroup or tails), or understand the most critical lipid types or specific lipid-protein interactions, prolint2 can accommodate your analysis needs.
3. Metrics: Bridging the Gap#
While the Universe and Contacts objects provide access to information at the residue-residue and atom-atom levels, the residue-lipid type level information was still missing. This is where the Metrics objects come into play. Following the established sequential flow, Metrics objects are initialized from Contacts instances.
prolint2 includes some default metrics for your convenience, including the SumMetric, MaxMetric, and MeanMetric. Let’s clarify the differences between these metrics:
SumMetric: This metric calculates the total number of interactions with the same lipid type and normalizes it over the entire trajectory, providing insights into the cumulative interaction strength.
MaxMetric: The MaxMetric identifies the maximum duration of interactions with the same lipid type, providing insights into the longest-lasting interactions normalized over the total number of frames.
MeanMetric: The MeanMetric computes the average duration of interactions with the same lipid type and normalizes it over the entire trajectory, offering a balanced view of interaction duration.
In addition to that, we also offer the opportunity to define new custom metrics by importing the UserDefinedMetric class. This flexibility allows you to tailor your interaction analysis to your specific research needs. Whether you are interested in using default metrics or developing custom ones, prolint2 makes it easy to extract meaningful insights at this interaction level.
4. Plotters#
The visualization tools, referred to as Plotters, are designed to provide a structured and logical approach to understanding the interactions within your system. When you begin analyzing your data, it’s helpful to start with exploratory Plotters. These tools are designed to identify the most relevant interactions within your system. By using them, you can get an overview of the interactions between the proteins and lipids. As you continue analyzing your data, you can delve deeper into the details of each interaction, down to the residue-lipid and atom-atom levels. This systematic approach will streamline your analysis and ensure that you uncover all relevant insights from your lipid-protein interaction data, in alignment with the interaction levels described earlier.